Analyzing a stock can be tricky at first, but this beginner-friendly and practical guide will help you make informed decisions when investing capital at risk. We'll explore the key metrics to look at when evaluating a company.
All of these metrics can be found when evaluating a company using a page like Yahoo finance or Investing.
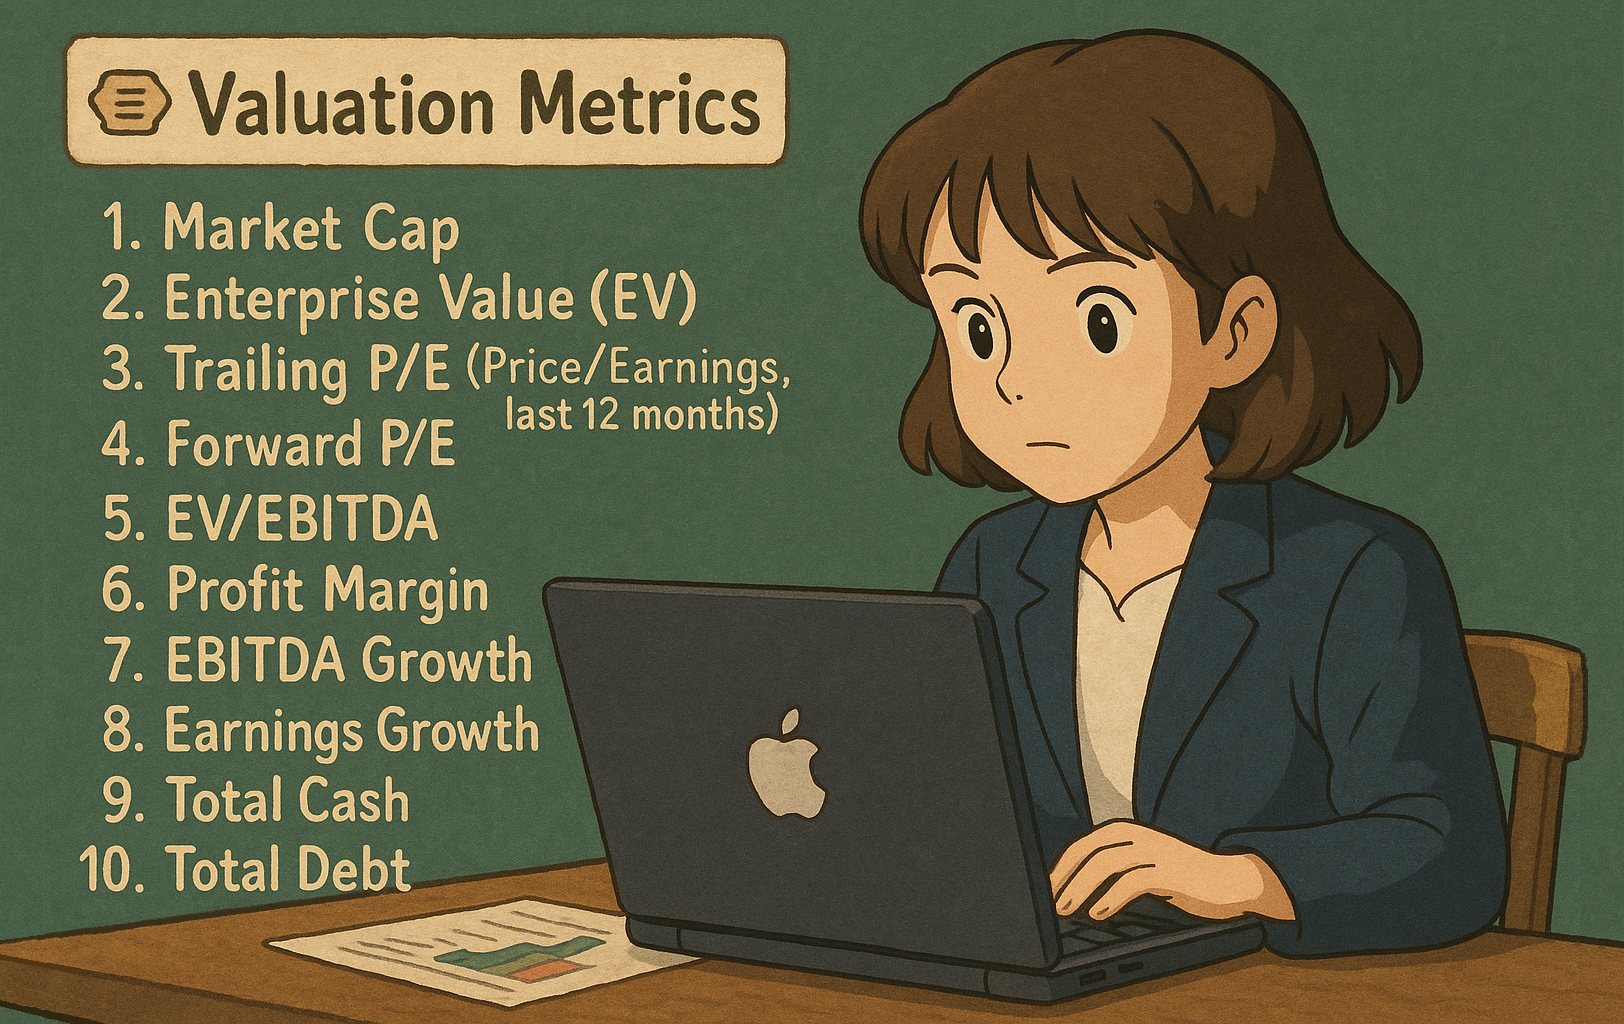
🏷️ Valuation Metrics
1️⃣ Market Cap
Definition: The total value of a company.
Formula: Market Cap = Share Price × Shares
- Tells you if a company is large or small.
2️⃣ Enterprise Value (EV)
Definition: A more complete measure than Market Cap for the value of the company, as it includes debt and cash.
Formula: EV = Market Cap + Debt - Cash
- EV is like the price you'd pay to buy the whole company, including its debts.
- In the formula the debt is added because if you were to buy a company, you have to take on its obligations too.
If the
EVis much higher than theMarket Cap, that's a bad sign because it means the company has a lot of debt.
3️⃣ Trailing P/E (Price/Earnings, last 12 months)
Definition: Ratio of price to earnings over the past year.
Lower is generally better, since that means that the earnings are greater.
Typically, a Trailing P/E below 17 suggests the stock may be undervalued; while above 18 could indicate overvaluation (though this varies by sector and company).
4️⃣ Forward P/E (Price/Earnings, next 12 months)
Definition: Ratio of price to expected future earnings over the coming year.
- If Forward P/E is higher than Trailing P/E, worse results are expected.
- If Forward P/E is lower than Trailing P/E, better results are expected.
5️⃣ EV/EBITDA
This might be the single most important metric, so stay with me for a second. It may sound complicated at first, but once it clicks, it’s actually pretty intuitive.
- Definition: EV/EBITDA is the ratio of Enterprise Value (EV) to Earnings Before Interest, Taxes, Depreciation, and Amortization (EBITDA).
- To make it easy: EV is the company's total value and EBITDA is its operating benefits (before taxes and other stuff). So, you can think of it as the company's price divided by its operating benefits.
- This metric tells you how many years it would take for the company to pay off its current valuation using its operating earnings.
For example, a EV/EBITDA of 10 means that the company would need 10 years to pay its current valoration (e.g., company is valued in $100M and generates $10M per year)
How to interpret EV/EBITDA 🧐
A value below 10 might suggest the company is undervalued or a potentially good buy. But be careful, it can also mean the company is in trouble or that investors lack confidence in its future.
A value above 10 could indicate the company is overvalued, or it might be seen as so innovative or promising that investors believe it deserves a premium price.
💰 Profitability
6️⃣ Profit Margin
- Measures how much profit a company makes from its revenue.
- The higher, the better.
- However, margins vary a lot by industry.
- Supermarkets have low margins (~2%).
- Tech companies can exceed 20%.
As a general rule of thumb:
- 5–10% = Average
- 10–20% = Good
- >20% = Excellent
📈 Income State
7️⃣ EBITDA Growth
- Look for growing EBITDA.
8️⃣ Earnings Growth
- Look for a consistent growth in earnings.
🏦 Balance Sheet
9️⃣ Total Cash
- The more, the better.
🔟 Total Debt
- The less, the better.
Check how long does the company need to repay its debt with EBITDA. The fewer years to pay off its debt, the better.
📉 Stock Price History
11 Beta
- Beta measures how much a stock’s price moves relative to the overall market.
- <1: Defensive (less volatile)
- =1: Neutral (moves with the market)
- >1: Aggressive (more volatile)
For example: if Beta = 2, and the market goes up by 100, the stock would go up by 200 (and vice versa).
📊 Insider Statistics
12 Percentage of Shares Held by Insiders
- The higher, the better. You want management to have skin in the game.
- When insiders own a significant stake, it often means they’re more aligned with shareholders and confident in the company’s future.
💸 Dividends
13 Dividend Yield and Payout
- For example: A 5% yield means you get $5 per $100 invested each year.
When a company pays a dividend, its market capitalization typically drops by that amount. So you're not gaining free money, just shifting value from the company to your pocket.
This is why dividends, while often seen as passive income, can be misleading, since they don't create value on their own. What really matters is the company’s quality.

🔍 Practical example:
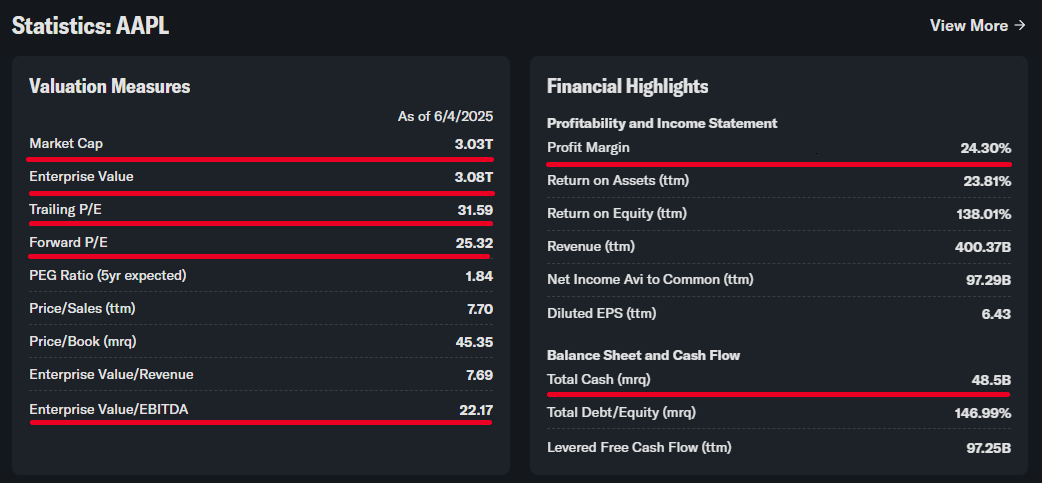
Let's take Apple (AAPL) as an example, visit its page in Yahoo Finance and scroll down to the Statistics section. You should see something like this:
🏷️ Valuation Metrics Analysis 🏷️
Market Cap: $3.03T <- High capitalization, one of the world's largest companies.
Enterprise Value: $3.08T <- Notice how EV ($3.08T) is slightly higher than Market Cap ($3.03T). This suggests Apple has more debt than cash, but the difference is relatively small, indicating a healthy balance sheet structure.
Trailing P/E: 31.59 <- High premium above our 17-18 benchmark, suggesting overvaluation or strong investor confidence.
Forward P/E: 25.32 <- The Forward P/E (25.32) is lower than the Trailing P/E (31.59), which is a positive sign. This indicates analysts expect Apple's earnings to grow over the next 12 months.
EV/EBITDA: 22.17 <- Above our threshold of 10, trading at a premium. While this could indicate overvaluation, it might also reflect investor confidence in Apple's innovation, market position, and future growth prospects.
💰 Profitability Analysis 💰
Profit Margin: 24.30% <- Excellent (>20% category), showing strong operational efficiency.
🏦 Balance Sheet Health 🏦
Total Cash: $48.5B <- Strong cash position for flexibility.
Final thoughts 🤔 : Apple shows excellent profitability but trades at premium valuations, requiring careful consideration of whether the price is justified.
Yahoo finance doesn't show all the metrics we discussed in this chart, only some of them. To find the rest, you’ll need to explore the site further.

Resources
- Main reference for this post: How to analyze a stock in 2024 (Spanish)
Conclusion
Looking at all the metrics will give you a clearer, more objective view of a company's value, profitability, and risk. Remember, no single metric tells the whole story.
That said, a good tip for beginners: the two most important metrics to focus on are EV/EBITDA and P/E.
You can explore other real examples (e.g., Amazon or Tesla) on platforms like Yahoo finance or Investing to get practice. Use these notes as your checklist! 😊
⚠️ Important: This guide is for educational purposes only and does not constitute financial advice. All investments carry risk, and it's important to do your own research before making any financial decisions.